What happens when I touch this?
You’re a great developer. Look at the quality blogs you read. If you’re starting a project today you’ll be using storyboards, organising your code in groups, everything will be well commented and it’ll be obvious in three years time what’s going on.
Meanwhile, back in reality, you’re working on an app that was first written for iOS4 and each of the dozen developers who’ve had a month to implement or fix things since then have gone in, done their stuff and moved on. Things get complicated. If you’re asked to work on an app, either to bolt more stuff onto it or (hooray!) to do some cleanup, then the very first thing you need to do is work out where you are and what’s going on.
I gave a lightning talk at iOSDevUK this year. I had five minutes to talk, so thought I’d cover the relatively simple(!) topic of how to navigate a massive, new codebase when you’re dropped in as a new developer and asked to fix problems or implement new features, right now. Here are the points I was trying to get across.
What’s on the screen?
It’s fairly simple to see which views are on the screen, thanks to the view debugger in Xcode (when it works) or tools like Reveal.
However, when you’re trying to work out where in the app you need to make changes, what’s often more useful is knowing which view controllers are currently in play. Most of the action in most iOS apps happens, or at least is kicked off, from code that lives in a view controller.
To find out what you’re looking at, you can pause the app in the debugger and type this:
po [[[UIWindow keyWindow] rootViewController] _printHierarchy]
This gives you a hierarchical list of the view controllers that are currently on screen, from the bottom up. A navigation controller will have the current stack displayed and any presented or child controllers will be included. If your app is showing child controllers without adding them to the hierarchy, you have another problem to solve.
The above command is quite long so at this point I’d recommend looking at Chisel, a collection of LLDB commands maintained by Facebook. Once you’ve installed Chisel you can type pvc instead, which is much easier.
What happens when I touch this?
The previous developer (don’t we all love to hate the previous developer, even if it was us) may have been “clever” in their use of code. Sometimes it’s not clear at all what happens when a button is tapped. To find out literally everything that ever happens in the app you’re working on, pause in the debugger and type this:
rb . -s MyApp
Replacing MyApp with the name of the current target. This magic incantation creates a regular expression breakpoint, using the rather unspecific regular expression of ., in the shared library known as MyApp. This creates a breakpoint on every method of your app. Every. Method. Of. Your. App. If you have timers or regular network hits, you may not get much use out of this, but otherwise it can really speed up your code navigation.
LLDB will create all of those breakpoints under a single umbrella breakpoint. This may take a while. You’ll want to turn them off again pretty sharpish since it makes actually working in the app quite painful. To do that, type this:
br li -b
This gives you a list of all the current breakpoints. Your regex one will be obvious, and it will have a number. To get rid of it, type this:
br delete X
Where X is the number.
Logjams
That idiot previous developer put hundreds of log statements in the app. Maybe they were a little bit helpful and made them DLog statements so they didn’t log plaintext passwords out to a customer’s device. However you still can’t use logging to find out when things happen (NSLog(@"IN VIEW DID APPEAR!!");) because there’s so much noise in there.
Good.
You shouldn’t be adding log statements for navigation anyway, and neither should that previous developer. You’re creating code changes, which you’ll need to roll back whenever you finally work out what the problem is.
To hide all that noise from the debugger console, look at the bottom of the window. There’s a popup there that says “All Output”. Click that and change it to “Debugger Output”. Now the only things you’ll see in the console are messages from the debugger.
Add a breakpoint in the method you’re interested in. Edit the breakpoint (right-click and choose Edit Breakpoint…). Choose Log Message as the action, and type your navigational info in there. Check Automatically continue…:
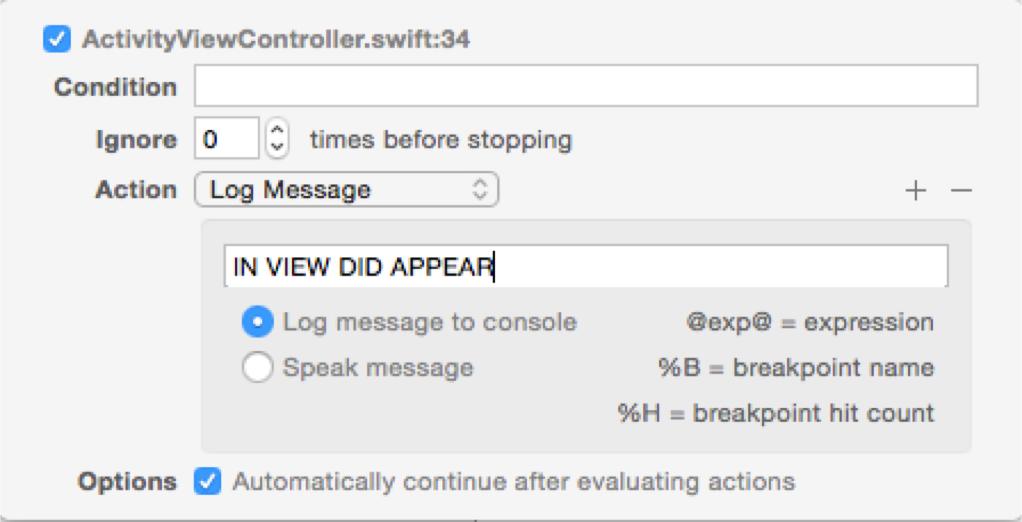
Now when you hit that breakpoint, it puts your message out into the clean, uncluttered debug console.
App mapping
You can combine two of the previous tips with a third and you have an instant method of mapping out screen changes in your app.
Create a symbolic breakpoint on -[UIViewController viewDidAppear:]. Add pvc as the debugger action and choose to automatically continue. Now exercise your app - as you move around and show screens, you’ll be shown a continuously up-to-date list of all the view controllers being put on the screen at the same time.
These few simple tips have really helped me when I’ve been dropped in an enemy codebase with no map. I hope they help you too.